


Dumps for Free Fortinet FCSS_NST_SE-7.6 Practice Exam Questions [Jul 27, 2026]
FCSS_NST_SE-7.6 Dumps PDF And Certification Training
NEW QUESTION # 80
An administrator wants to capture encrypted phase 2 traffic between two FotiGate devices using the built-in sniffer.
If the administrator knows that there Is no NAT device located between both FortiGate devices, which command should the administrator run?
- A. diagnose sniffer packet any 'udp port 500'
- B. diagnose sniffer packet any 'ah'
- C. diagnose sniffer packet any 'udp port 4500'
- D. diagnose sniffer packet any 'lp proto 50'
Answer: D
Explanation:
To capture encrypted IPsec phase 2 (ESP) traffic between two FortiGate devices, the correct protocol filter to use is ip proto 50. According to the Fortinet official sniffing and debugging documentation, ESP (Encapsulating Security Payload) is used for encrypted phase 2 payload transfer and always uses IP protocol number 50. Running the command diagnose sniffer packet any 'ip proto 50' captures only ESP packets, which represent the encrypted traffic-whether originating or transiting the device.
If there is no NAT device between FortiGates, ESP is not encapsulated in UDP (thus not on UDP port 4500; if NAT-T were required, packets would be UDP-encapsulated, but the scenario explicitly says NAT is not in use). UDP port 500 is for IKE control (negotiation) traffic, and AH (Authentication Header, ip proto 51) is not used for encryption in standard IPsec phase 2 with ESP.
This matches the official CLI reference from Fortinet for VPN and traffic analysis.
**
References:
FortiOS CLI Reference: diagnose sniffer packet, ESP, IP Protocol Numbers FortiGate VPN Administration Guide: Traffic Capture and Analysis of IPsec Traffic
NEW QUESTION # 81
Exhibit.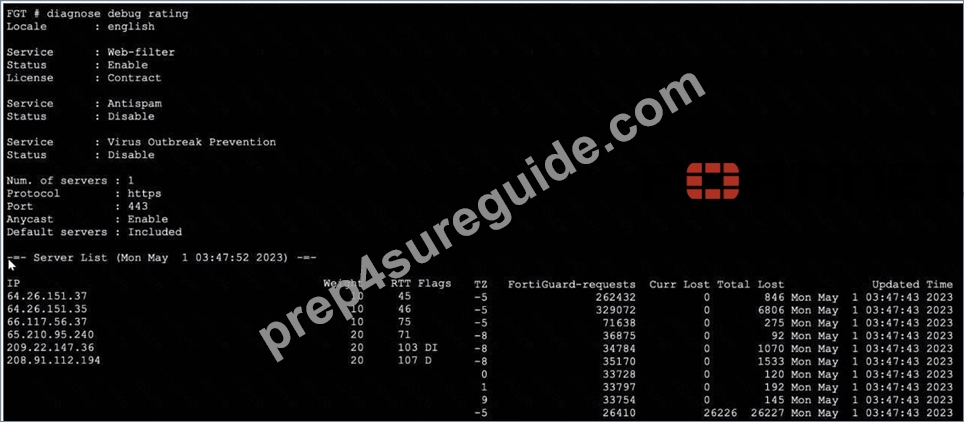
Refer to the exhibit, which shows the output of a diagnose command.
What can you conclude about the debug output in this scenario?
- A. FortiGate used 64.26.151.37 as the initial server to validate its contract.
- B. The first server provided to FortiGate when it performed a DNS query looking for a list of rating servers, was 121.111.236.179.
- C. Servers with a negative TZ value are less preferred for rating requests.
- D. There is a natural correlation between the value in the FortiGuard-requests field and the value in the Weight field.
Answer: D
NEW QUESTION # 82
Which two statements are true regarding heartbeat messages sent from an FSSO collector agent to FortiGate?
(Choose two.)
- A. The heartbeat messages must be manually enabled on FortiGate.
- B. The heartbeat messages can be seen using the command diagnose debug authd fsso list.
- C. The heartbeat messages can be seen on FortiGate using the real-lime FSSO debug.
- D. The heartbeat messages can be seen in the collector agent logs.
Answer: C,D
Explanation:
According to the official Fortinet documentation (Technical Tip: Useful FSSO Commands), heartbeat messages play a crucial role in communication between the FSSO Collector Agent and FortiGate. These messages are regularly sent from the Collector Agent to verify its status, maintain session awareness, and confirm connectivity between the authentication infrastructure and FortiGate appliances.
Option B is confirmed by Fortinet, as the collector agent logs on Windows or its management console will specifically note heartbeat events, connection status, and any issues maintaining contact with FortiGate units.
Option C is validated by both official CLI documentation and the technical tip linked. On FortiGate, heartbeat messages from the collector agent are visible using real-time debug tools such as diagnose debug application authd or FSSO-specific commands. These enable administrators to monitor live logon states, session status, and connection health directly from the FortiGate CLI. The debug stream shows heartbeats received and their effect on active logons, associating health monitoring with active sessions.
Heartbeat operation is fully automated once FSSO is set up-there is no requirement for manual enablement or configuration, aligning with Fortinet's philosophy of seamless integration and centralized management across the Security Fabric. This ensures that both FortiGate and the collector agent can quickly and reliably detect any miscommunication or outage, addressing authentication issues proactively.
References:
Technical Tip: Useful FSSO Commands (Fortinet Community)
FortiOS Administration Guide: FSSO, Collector Agent, Heartbeat, CLI Debug
NEW QUESTION # 83
Refer to the exhibit.
A partial output from an IKE real-time debug is shown
The administrator does not have access to (he remote gateway
Based on the debug output, which two conclusions can you draw? (Choose two.)
- A. There is a Diffie-Hellman group mismatch.
- B. The remote peer is the initiating peer.
- C. This is a phase1 negotiation.
- D. This is a phase2 negotiation
Answer: B,C
Explanation:
To determine the correct conclusions, we analyze the specific lines in the IKE real-time debug output provided in the exhibit:
Analysis for Option A (The remote peer is the initiating peer):
Evidence: The very first line of the debug output reads: ike 0:624000:98: responder: main mode get 1st message...
The keyword responder indicates that this local FortiGate is receiving the connection request. Consequently, the remote peer must be the initiator sending the request. The phrase "get 1st message" confirms the local unit is receiving the initial packet of the negotiation sequence.
Conclusion: This statement is True.
Analysis for Option B (This is a phase 1 negotiation):
Evidence: The same line mentions main mode.
In IPsec VPNs, Main Mode and Aggressive Mode are exclusively used for Phase 1 (IKE SA) negotiations.
Phase 2 (Child SA) negotiations use Quick Mode. The presence of "main mode" definitively identifies this as a Phase 1 exchange.
Conclusion: This statement is True.
Analysis for Option C (There is a Diffie-Hellman group mismatch):
Evidence:
Incoming proposal (Remote): Lists type=OAKLEY_GROUP, val=MODP2048 (Group 14) in the first proposal proposal.
My proposal (Local): Lists type=OAKLEY_GROUP, val=MODP2048 (Group 14).
Since both the remote peer and the local gateway support and are proposing MODP2048 (Group 14), there is no Diffie-Hellman group mismatch. The actual mismatch visible in the logs is between the Encryption/Hash algorithms (Remote proposes AES-256/SHA2-256, while Local proposes AES-128/SHA), but the DH groups match.
Conclusion: This statement is False.
Analysis for Option D (This is a phase 2 negotiation):
As established in the analysis for Option B, "Main Mode" is a Phase 1 protocol. If this were Phase 2, the debug would show "Quick Mode".
Conclusion: This statement is False.
Reference:
FortiGate Security 7.6 Study Guide (IPsec VPN): "Phase 1 modes: Main mode and Aggressive mode." FortiOS Debugging documentation: Explains that "responder" indicates the device receiving the IKE initialization.
NEW QUESTION # 84
Refer to the exhibit showing a debug output.
An administrator deployed FSSO in DC Agent Mode but FSSO is failing on FortiGate. Pinging FortiGate from where the collector agent is deployed is successful.
The administrator then produces the debug output shown in the exhibit.
What could be causing this error message?
- A. The FortiGate and the collector agent are using different TCP ports.
- B. The collector agent preshared password is mismatched.
- C. The FortiGate cannot resolve the active directory server name.
- D. The TCP port 445 is blocked between FortiGate and collector agent.
Answer: A
NEW QUESTION # 85
In the SAML negotiation process, which section does the Identity Provider (IdP) provide the SAML attributes utilized in the authentication process to the Service Provider (SP)?
- A. Authentication Request
- B. Assertion dump
- C. Authentication Response
- D. SP Login dump
Answer: B
Explanation:
The correct answer is D. Assertion dump.
The study guide states that: "SAML attributes are pieces of information about a user that are exchanged between IdPs and SPs during the SAML authentication process. These attributes are included in the SAML assertion, which is built by the IdP as part of the authentication process." It also shows the real-time SAML debug output under "** Assertion Dump ****"**, where the SAML attributes appear inside the assertion, such as:
<saml:Attribute Name="username">
<saml:Attribute Name="groups">
The same study-guide page explicitly labels this area as "Attributes sent by IdP" So, although the IdP sends an authentication response overall, the actual section that contains the SAML attributes is the Assertion dump
NEW QUESTION # 86
Refer to the exhibit.
FortiGate is showing continuous high CPU usage During a maintenance window, the CLI command diagnose sys top displays the output shown in the exhibit. The CLI command diagnose twat application ipsmonitor 5 was run. but the CPU usage by daemon ipsengine did not drop Which immediate action can you take to reduce the CPU usage effectively?
- A. Disable IPS on all firewall policies.
- B. Execute diagnose test application ipsMonitor 2inatead.
- C. Bypass all IPS engines
- D. Reduce the number of IPS signatures enabled on the active IPS profiles
Answer: B
Explanation:
To solve this high CPU usage scenario involving the ipsengine, we must understand the specific functions of the diagnose test application ipsmonitor commands shown in the troubleshooting steps.
Analyze the Situation:
Exhibit: The diagnose sys top output shows the ipsengine process is in a run state (R) consuming 99% CPU.
Previous Action: The administrator already ran diagnose test application ipsmonitor 5.
Result: The CPU usage did not drop.
Understand the Commands:
diagnose test application ipsmonitor 5: This command toggles IPS Bypass Mode. When enabled, the IPS engine lets traffic pass through without inspection.
Implication: If the CPU was high due to traffic volume, enabling bypass would drop the CPU load immediately.
Failure: Since the CPU remained at 99% after bypass, the ipsengine process is likely frozen, stuck, or in an internal infinite loop unrelated to the current traffic flow. The process itself is the problem, not the traffic volume.
Evaluate the Solution (Option B):
diagnose test application ipsmonitor 2: This command toggles the IPS engine's Enable/Disable status.
Because the engine is stuck (bypass failed to relieve pressure), the "Immediate action" required is to stop or restart the process entirely.
Running option 2 effectively disables/kills the stuck IPS engine instance, which will immediately drop the CPU usage to near zero. (It can then be toggled again to restart it).
Why other options are incorrect:
A (Reduce signatures): This is a tuning measure for normal operation, not an immediate fix for a stuck process at 99% CPU.
C (Disable IPS on policies): This is a configuration change that takes time and requires a commit; it is not the most immediate diagnostic tool available.
D (Bypass all IPS engines): This describes the action of command 5 (Bypass), which the prompt explicitly states was already performed and failed.
Reference:
FortiGate Security 7.6 Study Guide (IPS & Diagnostics): "Troubleshooting IPS high CPU: 1. Check top. 2.
Try bypass (ipsmonitor 5). 3. If CPU persists, restart the engine (ipsmonitor 99 or 2)."
NEW QUESTION # 87
Refer to the exhibit, which contains the output of diagnose vpn tunnel list.
Which command will capture ESP traffic for the VPN named DialUp_0?
- A. diagnose sniffer packet any ' ip proto 50 '
- B. diagnose sniffer packet any ' host 10.0.10.10 '
- C. diagnose sniffer packet any ' esp and host 10.200.3.2 '
- D. diagnose sniffer packet any ' port 4500 '
Answer: D
NEW QUESTION # 88
Refer to the exhibit, which shows the port1 interface configuration on FortiGate and partial session information for ICMP traffic.
What happens to the session information if a routing change occurs that affects this session?
- A. The session will be flagged as dirty but no route lookups will be performed.
- B. Sessions involving port7 or port19 will not have their routing information flushed.
- C. The session information will not change unless the current route has been removed from the routing table.
- D. Only the interface and gateway information for dev=7 will be removed.
Answer: C
NEW QUESTION # 89
Exhibit.
Refer to the exhibit, which contains partial output from an IKE real-time debug.
Which two statements about this debug output are correct? (Choose two.)
- A. The initiator provided remote as its IPsec peer ID.
- B. Perfect Forward Secrecy (PFS) is enabled in the configuration.
- C. It shows a phase 2 negotiation.
- D. The local gateway IP address is 10.0.0.1.
Answer: A,C
Explanation:
From the exhibit, you can observe that the debug output captures an IKEv1 negotiation in aggressive mode.
Let's break down the supporting details in line with official Fortinet IPsec VPN troubleshooting resources and debug guides:
For Option B:
The very first line of the debug output shows:
comes 10.0.0.2:500->10.0.0.1:500, ifindex=7.
This indicates the traffic direction-from the remote IP (10.0.0.2) with port 500 to the local IP (10.0.0.1) with port 500. According to Fortinet's documentation, the right side of the arrow always represents the local FortiGate gateway. Thus, 10.0.0.1 is the local gateway IP address.
For Option D:
You see the statement:
negotiation result "remote"
and
received peer identifier FQDNCE88525E7DE7F00D6C2D3C00000000
Official debug documentation describes that the "peer identifier" or peer ID sent by the initiator is displayed here. In the context of IKE/IPsec negotiation, this value is used as the IPsec peer ID for authentication and identification purposes. The initiator is providing "remote" as the peer ID for its connection.
Why Not A or C:
Perfect Forward Secrecy (PFS): The debug does not show any DH group negotiation in phase 2 (no reference to group2, group5, etc., for phase 2), so you cannot deduce the presence of PFS solely from this output.
Phase 2 negotiation: The log focuses on IKE (phase 1) negotiation and establishment; there's no reference to ESP protocol, Quick Mode, or other identifiers that would show phase 2 SA negotiation and establishment.
This interpretation aligns with the explanation in the FortiOS 7.6.4 Administration Guide's VPN section and the official debug command output samples published in Fortinet's documentation. It demonstrates how to distinguish between local and remote addresses and how to identify the use of peer IDs.
References:
FortiOS 7.6.4 Administration Guide: IPsec VPN and Debugging VPNs
Technical Support Resources on interpreting IKE debug output and peer ID roles
NEW QUESTION # 90
Refer to the exhibit, which shows the output o! the BGP database.
Which two statements are correct? (Choose two.)
- A. The advertised prefix of 10.20.30.0/24 is being advertised through the redistribution of another routing protocol.
- B. The first four prefixes are being advertised using a legacy route advertisement.
- C. The output shows all prefixes advertised by all neighbors as well as the local router.
- D. The advertised prefix of 10.20.30.0/24 was configured using the network command.
Answer: C,D
Explanation:
For Option A:In Fortinet BGP (and standard BGP), when a prefix is displayed with an " i " (lowercase i) in the Path column, it represents an internal prefix that originated from the local router, typically configured via the BGP " network " command. In the exhibit, the prefix 10.20.30.0/24 is listed with a Path value of i, indicating it was injected into BGP by the local router using the network statement, not via redistribution from another routing protocol. The same logic applies to i as documented: " Origin code ' i ' means the route was injected via the network command. " For Option D:The get router info bgp network output is a summary table displaying both local and received BGP routes. It lists all known routes to the BGP process, whether received from peers or originated locally.
The exhibit shows all BGP prefixes known to the local router, matching the official admin guide's description of this command's output.
Explanation for B and C:
The phrase "legacy route advertisement" is not formalized in BGP documentation or Fortinet's admin guide; the output uses standard BGP mechanics.
If a route was redistributed into BGP from another routing protocol, the Path field would display a " ? " (question mark) for incomplete (redistributed) origin. Here the /24 route has " i " so it is NOT a redistribution.
References:
FortiOS Administration Guide: BGP Configuration and Route Table Interpretation Official BGP Command Reference: Show BGP Network, Path Codes, Route Origination Indicators
NEW QUESTION # 91
Refer to the exhibits.
An administrator is attempting to advertise the network configured on port3. However, FGT-A is not receiving the prefix.
Which two actions can the administrator take to fix this problem? (Choose two.)
- A. Use the set network-import-check disable command.
- B. Manually add the BGP route on FGT-A.
- C. Modify the prefix using the network command from 172.16.0.0/16 to 172.16.54.0/24.
- D. Restart BGP using a soft reset to force both peers to exchange their complete BGP routing tables.
Answer: A,C
NEW QUESTION # 92
What can cause an IKEv2 tunnel to go down after it was initially brought up successfully?
- A. A mismatched Diffie-Hellman group was detected during the IKE_SA_INIT exchange.
- B. Mismatched quick-mode selectors were detected during the CREATE_CHILD_SA exchange.
- C. A mismatched pre-shared key was detected during the IKE_AUTH exchange.
- D. A mismatched proposal was detected during the IKE_AUTH exchange.
Answer: B
Explanation:
The correct answer is D.
The study guide explains that IKEv2 has two initial exchanges:
IKE_SA_INIT
IKE_AUTH
and then later exchanges such as:
CREATE_CHILD_SA
It also states the roles of those exchanges:
IKE_SA_INIT negotiates the security settings for IKE traffic
IKE_AUTH performs mutual authentication and sets up the piggyback child SA CREATE_CHILD_SA creates a new child SA or rekeys an existing child SA Most importantly, the study guide explicitly says:
"By IKEv2 design, no Diffie-Hellman public key is exchanged during an IKE_AUTH exchange. Consequently, any phase 2 Diffie-Hellman group configuration mismatch between FortiGate and the peer is experienced only during the first rekey (CREATE_CHILD_SA exchange) of the child SA created during IKE_AUTH." This proves the key idea behind the question: an IKEv2 tunnel can come up successfully first, then fail later during a CREATE_CHILD_SA rekey/renegotiation event because of a phase 2 mismatch. Among the provided options, the matching later-stage cause is mismatched quick-mode selectors during CREATE_CHILD_SA.
Why the other options are wrong:
A is wrong because if the proposal mismatch were in the initial negotiation path, the tunnel would fail during establishment, not after it was already up. The study guide places initial tunnel establishment in IKE_SA_INIT and IKE_AUTH B is wrong because a mismatch in IKE_SA_INIT affects the initial establishment stage, not a tunnel that was already brought up successfully C is wrong because a pre-shared key mismatch is part of authentication during IKE_AUTH, so the tunnel would not come up successfully in the first place
NEW QUESTION # 93
Refer to the exhibit, which shows partial outputs from two routing debug commands.
Which change must an administrator make on FortiGate to route web traffic from internal users to the internet, using ECMP?
- A. Set snat-route-change to enable.
- B. Set the priority of the static default route using port2 to 1.
- C. Set the priority of the static default route using port1 to 10.
- D. Set preserve-session-route to enable.
Answer: C
Explanation:
The 7.6 study guide explains the route selection order:
"Route Selection Process
Most specific route
Lowest distance
Lowest metric (dynamic routes)
Lowest priority (static routes)
ECMP (static, BGP, and OSPF routes)"**
It then states:
"If there are multiple routes with the same netmask, distance, metric, and priority, FortiGate shares the traffic among all of them. This is called equal-cost multi-path (ECMP)." The FortiOS administration guide confirms the ECMP prerequisite:
"Routes must have the same destination and costs. In the case of static routes costs include distance and priority." In the exhibit, the kernel/FIB output shows the two default routes as:
gwy=100.64.1.254 dev=3 (port1) prio=0
gwy=100.64.2.254 dev=6 (port2) prio=10
So although both are default routes, their priorities are different. Since FortiGate uses the FIB/kernel for forwarding traffic, ECMP will not happen until the static-route priorities are the same. The study guide also notes that the FIB is the table used to perform standard routing Therefore, to make the two default routes eligible for ECMP, the administrator must make the priorities equal. Since port2 is already 10, the needed change is to set the port1 default route priority to 10.
Why the other options are wrong:
A is wrong because snat-route-change affects how existing SNAT sessions react to routing changes, not whether static routes qualify for ECMP B is wrong because changing port2 to priority 1 still would not match port1 at 0, so the routes still would not have equal cost for ECMP C is wrong because preserve-session-route affects existing-session route persistence after routing changes, not ECMP qualification
NEW QUESTION # 94
Refer to the exhibit.
Which two observations can you make about the web filter traffic captured using the flow tool? (Choose two.)
- A. The HTTPS port is mapped to 443 in the SSL/SSH Inspection Profile
- B. The web filter profile is configured with proxy-based inspection mode.
- C. The session is offloaded to the NPU.
- D. The firewall policy is configured with proxy-based inspection mode.
Answer: B,D
Explanation:
Analyze the "Send to Application Layer" Message:
The most critical line in the debug output is: id=65308 ... func=av_receive ... msg="send to application layer" Meaning: This message indicates that the FortiGate kernel is handing the packet over to a user-space daemon (specifically the WAD/Proxy process, indicated by av_receive handlers) for deep inspection.
Implication: This behavior is the hallmark of Proxy-based inspection. In Flow-based inspection, the traffic is handled by the IPS engine (often within the kernel or via specific IPS handlers like ips_measure), and you would not typically see a "send to application layer" message for standard web filtering.
Evaluate Option B (Firewall Policy Mode):
Since the traffic is being sent to the application layer proxy, the Firewall Policy controlling this traffic (Policy ID 1, as seen in Allowed by Policy-1) must be configured with Inspection Mode = Proxy. If it were Flow- based, the traffic would stay in the flow path. Thus, Option B is correct.
Evaluate Option C (Web Filter Profile Mode):
In FortiOS, when a firewall policy is set to Proxy-based inspection, the security profiles (like Web Filter) applied to that policy also operate in Proxy-based inspection mode. The presence of the av_receive function confirms that the content inspection (Web Filter/AV) is being performed by the proxy engine. Thus, Option C is correct.
Why Option A is Incorrect (NPU Offload):
The output shows npu_state=0x100. In the context of a flow trace where traffic is being "sent to application layer," this confirms the session is not fully offloaded to the NPU (Network Processor). Offloaded traffic (Fast Path) is handled by the hardware and would not generate these specific CPU-level debug logs for the payload inspection phase. The proxying process requires CPU intervention.
Why Option D is Incorrect (Port Mapping):
While valid protocol mapping is necessary for inspection, the specific debug output shown is a direct result of the Inspection Mode (Proxy vs. Flow). The observation of the traffic moving to the application layer is primarily caused by the policy and profile mode settings, making B and C the direct "observations" derived from the log data.
Reference:
FortiGate Troubleshooting (Debug Flow): "If the debug flow shows msg='send to application layer', it confirms the traffic is being handled by the proxy (WAD) for Proxy-based inspection."
NEW QUESTION # 95
Refer to the exhibit, which shows the output of a policy route table entry.
Which type of policy route does the output show?
- A. A regular policy route, which is associated with an active static route in the FIB
- B. An SD-WAN rule
- C. An ISDB route
- D. A regular policy route
Answer: C
Explanation:
The exhibit for question 4 shows a policy route table entry, and key fields are as follows:
internet service(1) : Fortinet-FortiGuard(1245324,0.0.0.0,0.0.0.0)
According to the Fortinet official documentation, when a policy route is based on Internet Service Database (ISDB) entries, the route entry will specifically mention "internet service," showing the service being referenced (in this example, Fortinet-FortiGuard). This is fundamentally different from a regular policy route, which is defined by source, destination, and service wildcards without referencing an ISDB signature. A regular policy route's output would not contain the line "internet service." Policy routes that use ISDB allow FortiGate to steer traffic for specific well-known services (like FortiGuard, Google, Microsoft) based on traffic pattern recognition, even if the destination IP is dynamic. The matching and route selection follow the ISDB tag and can coexist with static or regular policy routes.
Thus, this entry is correctly and uniquely an ISDB route, as explained in the FortiOS policy routing documentation and ISDB configuration references.
References:
FortiOS Administration Guide: Policy Routing, ISDB integration and interpretation of route table entries ISDB-based Routing and Official CLI Outputs in Fortinet's documentation
NEW QUESTION # 96
Refer to the exhibit.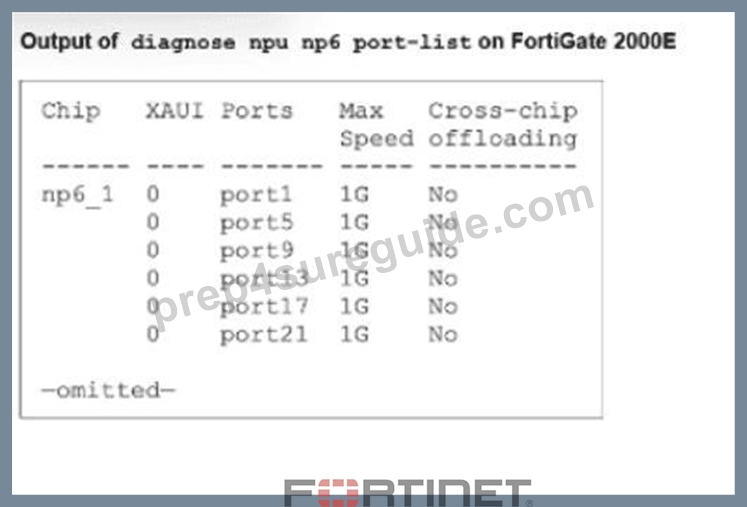
A partial output of diagnose npu up6 port-list on FortiGate 2000E is shown.
An administrator is unable to analyze traffic flowing between port1 and port17 using the diagnose sniffer command.
Which two commands allow the administrator to view the traffic? (Choose two.)
- A.

- B.

- C.

- D.

Answer: A,D
Explanation:
The administrator cannot see traffic in the sniffer because it is being offloaded to the NPU (NP6). To view the traffic, offloading must be disabled so packets pass through the CPU.
B). config firewall policy ... set auto-asic-offload disable: This is the recommended method to troubleshoot specific traffic. By disabling ASIC offloading in the relevant firewall policies (Policies 5 and 17 in the exhibit), traffic is forced to the CPU and becomes visible to the sniffer.
C). diagnose npu np6 fastpath disable 1: This command temporarily disables the fastpath processing on the specific NP6 processor (ID 1) handling the ports. This forces all traffic handled by that NPU to the CPU, allowing the sniffer to capture it.
Incorrect Options: Option A uses invalid syntax (port-list disable is not a valid command). Option D (config system npu) is not the standard method for granular troubleshooting.
NEW QUESTION # 97
Refer to the exhibit.
FortiGate is showing continuous high CPU usage During a maintenance window, the CLI command diagnose sys top displays the output shown in the exhibit. The CLI command diagnose twat application ipsmonitor 5 was run. but the CPU usage by daemon ipsengine did not drop Which immediate action can you take to reduce the CPU usage effectively?
- A. Disable IPS on all firewall policies.
- B. Execute diagnose test application ipsMonitor 2inatead.
- C. Bypass all IPS engines
- D. Reduce the number of IPS signatures enabled on the active IPS profiles
Answer: B
Explanation:
To solve this high CPU usage scenario involving the ipsengine, we must understand the specific functions of the diagnose test application ipsmonitor commands shown in the troubleshooting steps.
* Analyze the Situation:
* Exhibit: The diagnose sys top output shows the ipsengine process is in a run state (R) consuming 99% CPU.
* Previous Action: The administrator already ran diagnose test application ipsmonitor 5.
* Result: The CPU usage did not drop.
* Understand the Commands:
* diagnose test application ipsmonitor 5: This command toggles IPS Bypass Mode. When enabled, the IPS engine lets traffic pass through without inspection.
* Implication: If the CPU was high due to traffic volume, enabling bypass would drop the CPU load immediately.
* Failure: Since the CPU remained at 99% after bypass, the ipsengine process is likely frozen, stuck, or in an internal infinite loop unrelated to the current traffic flow. The process itself is the problem, not the traffic volume.
* Evaluate the Solution (Option B):
* diagnose test application ipsmonitor 2: This command toggles the IPS engine's Enable
/Disable status.
* Because the engine is stuck (bypass failed to relieve pressure), the "Immediate action" required is to stop or restart the process entirely.
* Running option 2 effectively disables/kills the stuck IPS engine instance, which will immediately drop the CPU usage to near zero. (It can then be toggled again to restart it).
* Why other options are incorrect:
* A (Reduce signatures): This is a tuning measure for normal operation, not an immediate fix for a stuck process at 99% CPU.
* C (Disable IPS on policies): This is a configuration change that takes time and requires a commit; it is not the most immediate diagnostic tool available.
* D (Bypass all IPS engines): This describes the action of command 5 (Bypass), which the prompt explicitly states was already performed and failed.
Reference:
FortiGate Security 7.6 Study Guide (IPS & Diagnostics): "Troubleshooting IPS high CPU: 1. Check top. 2.
Try bypass (ipsmonitor 5). 3. If CPU persists, restart the engine (ipsmonitor 99 or 2)."
NEW QUESTION # 98
Exhibit.
Refer to the exhibit, which shows the output of diagnose automation test.
What can you observe from the output? (Choose two.)
- A. The automation stitch test is not being logged.
- B. The test was unsuccessful.
- C. The automation stitch test failed but the HA failover was successful.
- D. An HA failover occurred.
Answer: A,B
NEW QUESTION # 99
Which two statements about an auxiliary session ate true? (Choose two.)
- A. With the auxiliary session setting enabled. Iwo sessions are created in case of routing change.
- B. With the auxiliary session setting enabled. ECMP traffic is accelerated to the NP6 processor.
- C. With the auxiliary session selling disabled, only auxiliary sessions are offloaded.
- D. With the auxiliary session setting disabled, for each traffic path. FortiGate uses the same auxiliary session.
Answer: A,B
Explanation:
Auxiliary sessions in Fortinet are designed to support ECMP (Equal Cost Multi-Path) and SD-WAN scenarios, allowing sessions to be handled efficiently when traffic needs to be dynamically distributed across multiple links. With the auxiliary session setting enabled, FortiGate creates additional session table entries for each possible path in ECMP or SD-WAN-meaning that if the routing path changes (such as a link failover), a new session can be immediately activated and offloaded to the NP6 network processor for acceleration, ensuring minimal disruption. This greatly benefits high-throughput deployments.
Official documentation specifies that when auxiliary sessions are enabled, FortiGate doesn't just rely on dynamically creating new sessions after a routing event, it proactively creates sessions for all potential paths. This means that in the event of a route change, two sessions exist and the traffic is quickly re-routed and offloaded, maximizing performance and reliability. Without this feature, multiple paths cannot be efficiently offloaded, and routing changes trigger a single session update, reducing failover performance.
References:
FortiOS Handbook: Session Table, ECMP, SD-WAN, and Auxiliary Sessions
FortiGate NP6 Acceleration Guide: Auxiliary Session Behavior
NEW QUESTION # 100
Refer to the exhibit, which shows the omitted output of a session table entry.
Which two statements are true? (Choose two.)
- A. The traffic matches Policy ID 1.
- B. NP7 is handling offloading of this session.
- C. The session has been offloaded.
- D. The traffic has been tagged for VLAN 0000.
Answer: A,C
Explanation:
In the provided session table output, the following details justify the answers:
Policy ID Match: The line policy_id=1 directly confirms that this session was matched by Firewall Policy ID 1. According to Fortinet's session table documentation, the policy_id field always references the policy that allowed this session, so this is a clear indicator.
Session Offloading: The presence of the strings npu_state, ips_offload, and notably the NPU info section such as offload=8/8, ips_offload=1/1 shows that this session has been offloaded to the Network Processor Unit (NPU). Fortinet technical documentation states that "offload" values greater than zero in both directions (and an NPU info section) affirm that NPU hardware processing (fast path) is handling this traffic, thus the session is not being handled in software only.
Other options:
VLAN Tagging (vlan=0x0000/0x0000): This means no VLAN tag is assigned to this session.
NP7: The actual NPU model handling the session isn't exposed in this snippet-the offload parameters shown are generic and not specific to NP7 hardware, so it cannot be concluded from the session data.
References:
Fortinet Technical Tip: FortiGate Session Table and NPU Offloading
FortiOS Diagnostics Guide: Policy ID, Offload, and VLAN Session Table Fields
NEW QUESTION # 101
Which two protocol states indicate that traffic is bidirectional? (Choose two.)
- A. proto_state=01 for a TCP session.
- B. proto_state=01 for a UDP session.
- C. proto_state=05 for a TCP session.
- D. proto_state=00 for an ICMP session.
Answer: A,B
Explanation:
The correct answers are A and B .
For UDP , the study guide states this directly: "For UDP, the session state can have only two values: 00 when traffic is only one way, and 01 when traffic is two ways. For ICMP, the protocol state is always
00."
That makes B correct and D incorrect.
For TCP , the study guide explains that the protocol state is a two-digit number, where the first digit is the server-side state and the second digit is the client-side state . It also states that the first digit is 0 when the session is not subject to any inspection , and the TCP state table shows that value 1 = ESTABLISHED So, for a normal non-proxied/non-inspected TCP session, proto_state=01 means the TCP session is in the ESTABLISHED state. An established TCP session means the three-way handshake has completed, which requires traffic in both directions. That is why A is correct.
The study guide also says: "proto_state=11 means that the TCP three-way handshake for both server- side and client-side is completed (ESTABLISHED)." This confirms that TCP state value 1 represents an established state.
Why C is not selected: the study guide defines value 5 as TIME_WAIT and says: "When a session is closed by both the sender and receiver, FortiGate keeps that session in the session table for a few seconds...
This is the state value 5."
So proto_state=05 represents a closing/closed TCP session in TIME_WAIT , not the normal bidirectional state the question is testing.
Therefore, the verified answers are A and B .
NEW QUESTION # 102
Which of the following regarding protocol states is true? (Choose one answer)
- A. proto_state=10 indicates an established TCP session.
- B. proto_state=00 indicates that UDP traffic flows in both directions.
- C. proto_state=01 indicates one-way ICMP traffic.
- D. proto_state=01 indicates an established TCP session.
Answer: D
NEW QUESTION # 103
Exhibit.
Refer to the exhibit, which contains a screenshot of some phase 1 settings.
The VPN is not up. To diagnose the issue, the administrator enters the following CLI commands on an SSH session on FortiGate:
However, the IKE real-time debug does not show any output. Why?
- A. The debug shows only error messages. If there is no output, then the phase 1 and phase 2 configurations match.
- B. The log-filter setting is incorrect. The VPN traffic does not match this filter.
- C. The administrator must also run the command diagnose debug enable.
- D. Replace diagnose debug application ike -1 with diagnose debug application ipsec -1.
Answer: C
Explanation:
To display debug output on FortiGate devices, you must always run both the application-specific debug command and the global debug enable command. The command diagnose debug application ike -1 sets up the detail level for the IKE daemon debug, but it does not display any debug output on its own. As described in the FortiOS CLI debugging manuals, the command diagnose debug enable activates debug output on the console, making all previously set debugs visible. This is especially important for VPN troubleshooting-without the enable command, no output appears even if there is VPN traffic.
The correct diagnostic sequence is:
diagnose debug application ike -1
diagnose debug enable
This procedure is found in every FortiOS CLI debug tutorial and troubleshooting workflow.
References:
FortiOS CLI Reference: Debugging VPNs and Real-time Debug Output
FortiGate VPN Troubleshooting Guide: Required Steps for Debug Output
NEW QUESTION # 104
......
Fortinet FCSS_NST_SE-7.6 Exam Syllabus Topics:
| Topic | Details |
|---|---|
| Topic 1 |
|
| Topic 2 |
|
| Topic 3 |
|
| Topic 4 |
|
| Topic 5 |
|
Check your preparation for Fortinet FCSS_NST_SE-7.6 On-Demand Exam: https://www.prep4sureguide.com/FCSS_NST_SE-7.6-prep4sure-exam-guide.html
Practice Exam FCSS_NST_SE-7.6 Realistic Dumps Verified Questions: https://drive.google.com/open?id=1ZL-zXNAQsrLbZRL-3yAgivUaa_NjDFJD